
Recovery objectives: RPO, RTO, and the recoverable window in downpipes
This page is for an auditor who wants to read the two recovery-objective signals downpipes surfaces and judge how far to rely on each. A recovery point objective (RPO) asks how much recent data you could lose; a recovery time objective (RTO) asks how long getting it back would take. downpipes surfaces a signal for each, and the two have different limits, so read them separately.
The short version is this. The Overview screen’s Recovery point figure is your fleet’s worst case: the oldest good run across every downpipe, the most you could lose if only one downpipe were reachable. A newest-good-backup freshness line appears elsewhere (the Overview’s Executive summary and Fleet health text, and the runs screen’s latest-run tile) as a plain “how recent is my newest backup” reading, not an RPO figure. The recovery time is a derived estimate, computed from the throughput your own restore tests actually measured, and it is approximate. Neither is a guarantee.
The recovery point: your fleet’s worst case, not its best
The Overview screen’s Recovery point tile reads your fleet’s worst case: the age of the oldest good run across every downpipe, labelled “Oldest good backup”. An RPO tells you the most you could lose, and the most you could lose is bounded by your stalest downpipe, not your freshest one, so the tile reads the oldest good run.
Do not confuse this with the other, plainer freshness readings the console also shows. The Overview’s Executive summary reads “the newest good backup is” followed by a relative time, the Fleet health panel carries a “newest good backup” line, and the runs screen’s latest-run tile carries it as its secondary line. The latest-run tile’s headline figure is the age of the newest run of any status, which can be a failed or unfinished run (console/src/screens/runs/summary.ts). The three “newest good backup” readings are the age of the newest good run: a “how fresh is my best backup” signal, useful for judging whether backups are still running at all, but not the number an auditor should quote as RPO exposure. Read the Recovery point tile specifically for that.
This is a freshness signal, not an interactive picker. It answers “how much could I lose right now”, and when there is no recovery point it says so: when no downpipe has run at all, the tile reads “No drills yet” with an “Unproven” status rather than a point; when at least one downpipe has no good run, it reads “No good backup” with a count such as “2 of 5” rather than silently leaving that downpipe out of the worst case.
A recovery point is the freshness of the data you could recover, not a promise about how much you would lose in every scenario. The Recovery point tile reports your fleet’s oldest good run; it does not assert that this is your contracted RPO.
Why a worst-case reading, not a timestamp picker
The engine can resolve which run was current as of a given moment. That capability is real and it is described below. What the product does not offer is a console screen that lets you pick an arbitrary time and recover to it. So the RPO figure is deliberately framed as a run-history reading the product can back (the fleet’s oldest good run), not a timeline cursor.
The freshness of that recovery point also has a floor set by how often a run can start. The engine dispatches on a cron tick, so a backup cannot start sooner than the next tick regardless of the cadence you request. That tick is the granularity limit on how fresh any downpipe’s newest good run can be. The engine architecture describes it as the roughly fifteen-minute dispatch floor.
The recovery time: a derived, approximate estimate
The recovery time is an estimate, shown on the reports screen as a panel beneath the SLA compliance report and inside the same card. It appears both fleet-wide as a headline and per downpipe beneath it. It is a derived projection, never a stored target.
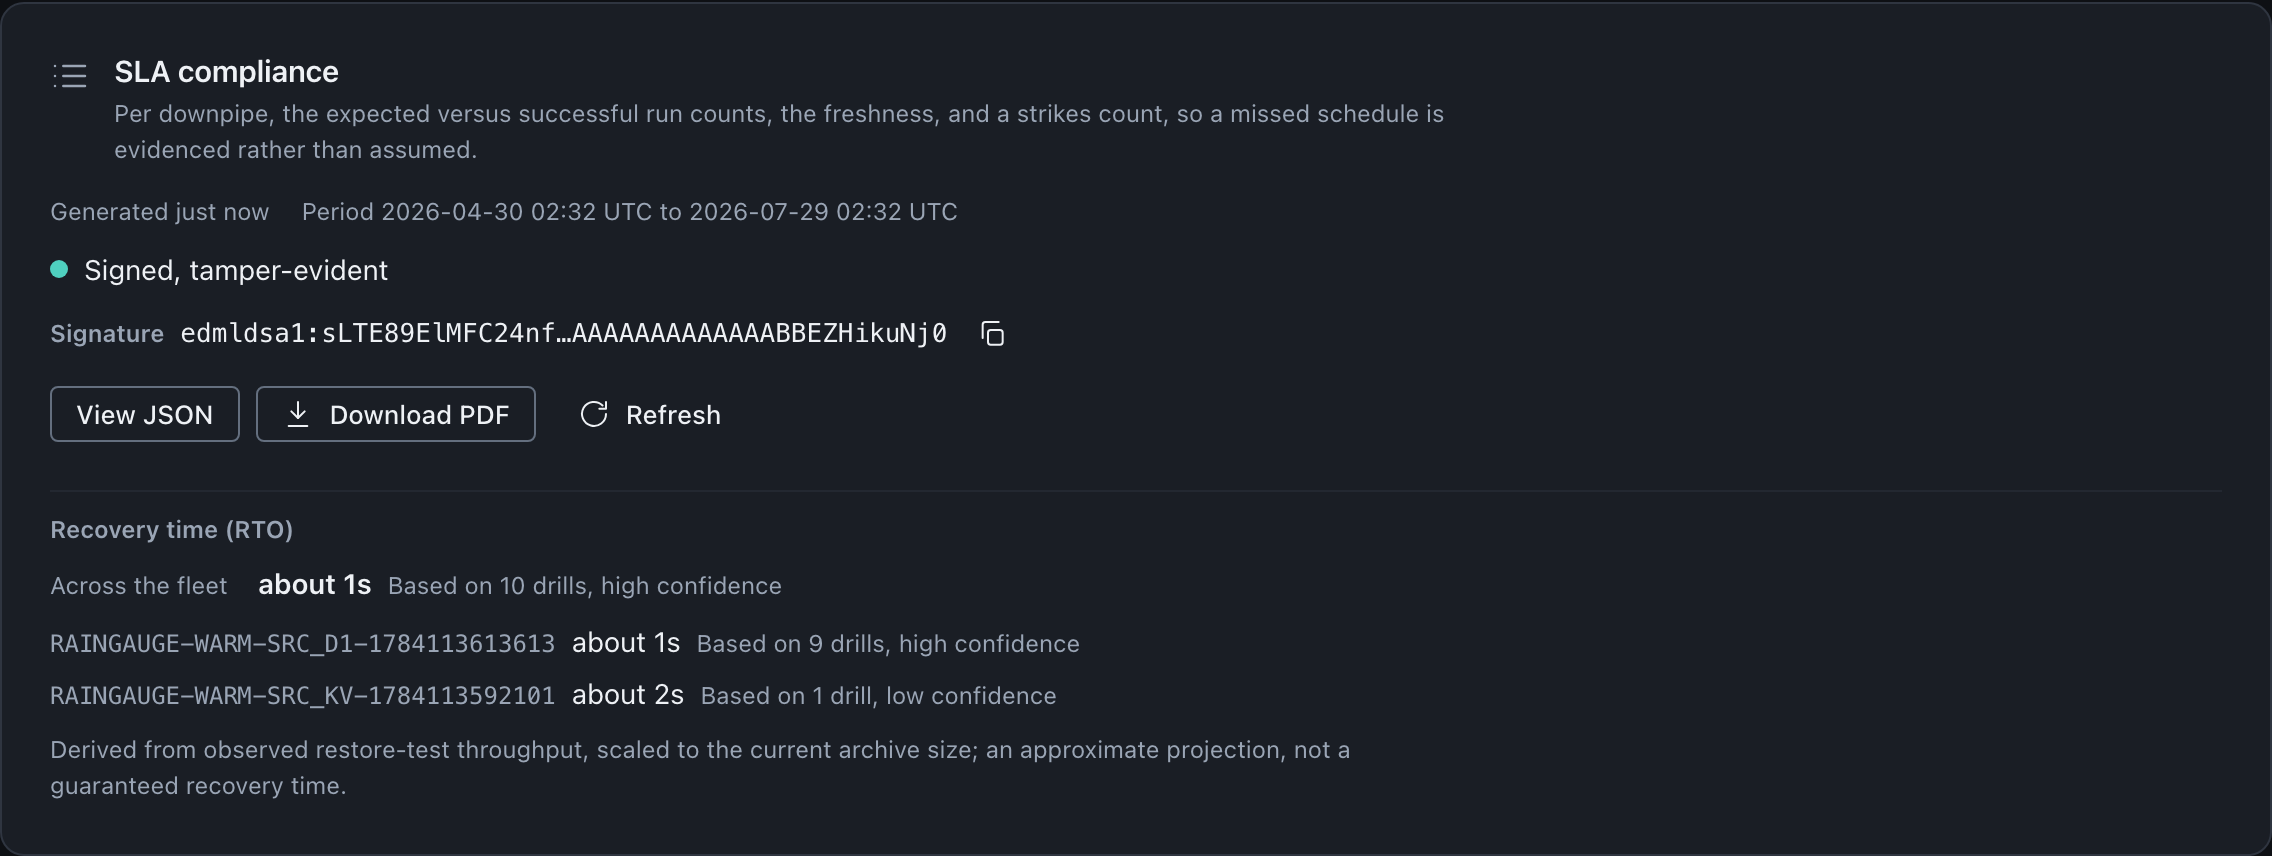
Here is how the estimate is built. When a restore test runs and verifies real data, the engine records the wall-clock the test took and the plaintext bytes it decrypted and verified. From those samples it computes an observed throughput, in bytes verified per second. It then scales that up to your archive’s current size to estimate how long a full recovery would take. A read-back drill opens and verifies the archive, which is the same work a recovery does, so its throughput is the proxy for recovery time. Backup write time is a different quantity and is not used.
| What you read | Where it comes from |
|---|---|
| The recovery-time estimate | The observed throughput of your restore tests, scaled to the current archive size |
| The “based on N drills” basis | The count of usable restore-test samples that fed the estimate |
| The confidence word | A coarse read of how many samples there are and how much of the archive they covered |
No history: unknown rather than a guessed number
With no restore-test history there is no signal, so the estimate is unknown. The engine returns a result marked not-known with confidence “none” and a reason that points you at running a restore test. The reports panel renders that as “Unknown (no recovery drills yet)”. It never substitutes a guessed constant for a missing measurement.
When the estimate is known, it carries two markers so you can weigh it. The first is the “based on N drills” sample count, the number of usable measurements behind the figure. The second is a coarse confidence, one of “none”, “low”, “medium” or “high”. Confidence rises with the sample count and with how much of the archive the drills actually covered: a single sample, or one that verified only a thin slice of a large archive, reads as low confidence because the scale-up is a large extrapolation; several consistent samples covering a representative share read higher.
Every known estimate also carries a fixed caveat, stated identically by the engine and the console, so the projection is never read as a promise:
The RTO caveat, from engine/src/admin/rto.ts
Derived from observed restore-test throughput, scaled to the current archive size; an approximate projection, not a guaranteed recovery time.
Not a guarantee or an SLA
The recovery-time estimate is a projection from your own measured drills, not a service level the product commits to. With no drill history it is unknown, and even with history it is approximate by construction. Treat it as a planning figure, not a contractual one.
Scheduled restore tests feed the estimate
The estimate improves as drills accumulate, and the way to accumulate them is to run restore tests. A successful restore test that measured a positive duration and verified at least one byte contributes one recovery-throughput sample to a bounded per-downpipe ring; the newest twenty samples are kept and the oldest roll off. A failed test, or one taken under a break-glass-only posture where no in-account read-back runs, carries no measurement and adds no sample, so the estimate stays unknown until a drill measures recovery work. A malformed measurement is dropped rather than folded in, so a bad sample cannot poison the figure.
One distinction matters for an auditor reading the code. A scheduled restore test updates the recency of the last test and feeds the recovery-time samples. It does not stamp the separate “offline restorability last proven” record. That record is written only when a blind restore test or a keyless attestation passes, which is a different path; the scheduled test on its own does not set it.
The recoverable window
The engine can resolve which run was current as of a given time. A pure resolver takes a downpipe, its run-history ring and an instant, and returns the latest successful run completed at or before that instant. It is exposed as an admin route and a console API method. The restore screen’s calendar (Browse by date, beside the plain run-id picker) is built directly on this resolver.
The calendar browses retained runs; it is not an arbitrary-time cursor
Restore’s calendar marks the days that hold a retained run and lists that day’s times when you open one, but choosing a day still resolves to one of your retained runs, never an arbitrary instant. The calendar opens on the current UTC month and selects the latest day in that month that holds a restorable run; if the month holds none, no day is selected (mountCalendar, console/src/screens/restore-flow/date-picker.ts). Both the plain run picker and the calendar choose a specific run by its id from the same bounded run history. Do not read a chosen day as a timestamp cursor; it is a faster way to find the run you want. (This per-downpipe newest-good-run reading is the runs screen’s freshness line, not the Overview’s fleet-wide Recovery point tile, which reads the oldest good run across every downpipe; see above.)
Both restore paths pick a run by its id. The run history they pick from is a bounded ring that retains the most recent fifty runs per downpipe; older runs roll off the ring. That ring is the recoverable window the portal can offer, and it is a different thing from your retention policy: retention is configured as keepRuns or keepDays and governs which archives are kept at the destination, while the fifty-run history ring is the in-engine list of recent runs the restore flow chooses from.
The resolver reports the edges of that window too. If you asked it for a time older than the oldest run the ring still holds, it does not silently hand back the oldest run. That would misrepresent the recovery point. It reports a miss and states the retained window bounds instead, and the calendar applies the same rule in its grid: a day before the ring’s own floor is labelled as beyond the shown history, never as unrecoverable. An older run has simply rolled off the ring; it remains restorable by its id from the plain run picker, which the calendar links to directly for this case.
For an auditor: the resolver semantics and the bounded ring
The resolver, resolveRunAt in engine/src/admin/point-in-time.ts, applies an at-or-before rule. For a given instant T it returns the latest successful run whose completion instant is at or before T. Only successful runs are eligible, because a failed, abandoned or in-flight run sealed no recoverable archive and is never a recovery point. A run’s completion instant is its start time plus its measured duration; a row with no recorded duration falls back to its start time, the conservative under-estimate, so a query never over-claims a fresher recovery point than the row can prove.
On a miss the resolver returns the completion-time bounds of the successful runs the ring currently holds, so a caller can state the window you can restore within. It distinguishes a T that precedes every retained run from a downpipe that has no successful run in the ring at all. The admin route, GET /admin/runs/at, is a thin authenticated forwarder gated on read access; the resolution shape is PointInTimeRun. The console mirrors that type and the calendar reads this route directly for its own floor: it queries an instant no real run could predate, which always misses, and the resolver attaches its window bounds to every miss regardless of the queried instant, so the calendar’s ring-boundary framing is the resolver’s own answer, not a client-side reimplementation of it.
The fifty-run history ring is a module constant in the scheduler durable object. It bounds storage growth: only the most recent fifty runs survive per downpipe, newest at the tail. This is the list the restore flow (and its calendar) picks a run id from, distinct from the retention policy that governs destination archives.
What the reports screen does and does not assert
The recovery-time panel sits beside the signed reports, so two limits of that surface are worth carrying here. The reports are signed and tamper-evident, and the console shows that a signature is present and well-formed; it does not verify the signature cryptographically in the browser, because the verifying key is not shipped there. Verification is an out-of-band step against the engine signer. And there is no live assurance dashboard and no usage or billing surface in the product; the reports panel is a read over your own observable state, not a live attestation feed.
Neither the recovery point nor the recovery time is ever coloured to imply more than it knows. An unknown recovery-time estimate reads as unknown, never as a reassuring figure. A fleet with no run yet reads as unproven, and a downpipe with no good backup is counted, never shown as a green all-clear.
Where this fits
These two signals sit on top of the run history and the restore path, so the pages below carry the mechanics behind them.
The restore flow
How a restore picks a run by its id, the dry-run plan and the gated apply, and why a restore is never automatic.
Prove recoverability
What a drill verifies, how a scheduled restore test runs, and how each one feeds the recovery-time estimate.
Retention and pruning
How keepRuns and keepDays govern which archives are kept, the policy distinct from the fifty-run history ring.
The engine architecture
The cron dispatch model and the roughly fifteen-minute floor that sets how fresh a recovery point can be.
Last updated .