
Connect downpipes to the tools you already run
downpipes runs alongside your Cloudflare backups and reports into the rest of your stack. This section has one setup guide per supported product, so you can go straight to the vendor you run and follow the exact steps for it rather than a generic recipe.
The guides fall into three groups.
Identity
Sign in to the downpipes console with the identity provider your organisation already runs. Each guide covers the provider-specific values its preset needs (for example a tenant id or an Okta domain) plus how group-to-role mapping reaches downpipes. The shared mechanics of a connection live on Connect OIDC or OAuth2 and Connect SAML.
SIEM
Forward the hash-chained audit trail to the SIEM you run, by push, by pull or by an object-store drop. Each guide names the format, the sink and the exact one-time step that platform needs before your events parse. Only Splunk and Datadog parse a first-time feed with no field mapping on your side; every other guide gives the step its platform needs first. The push mechanics common to all of them live on Forwarding the audit log to your SIEM.
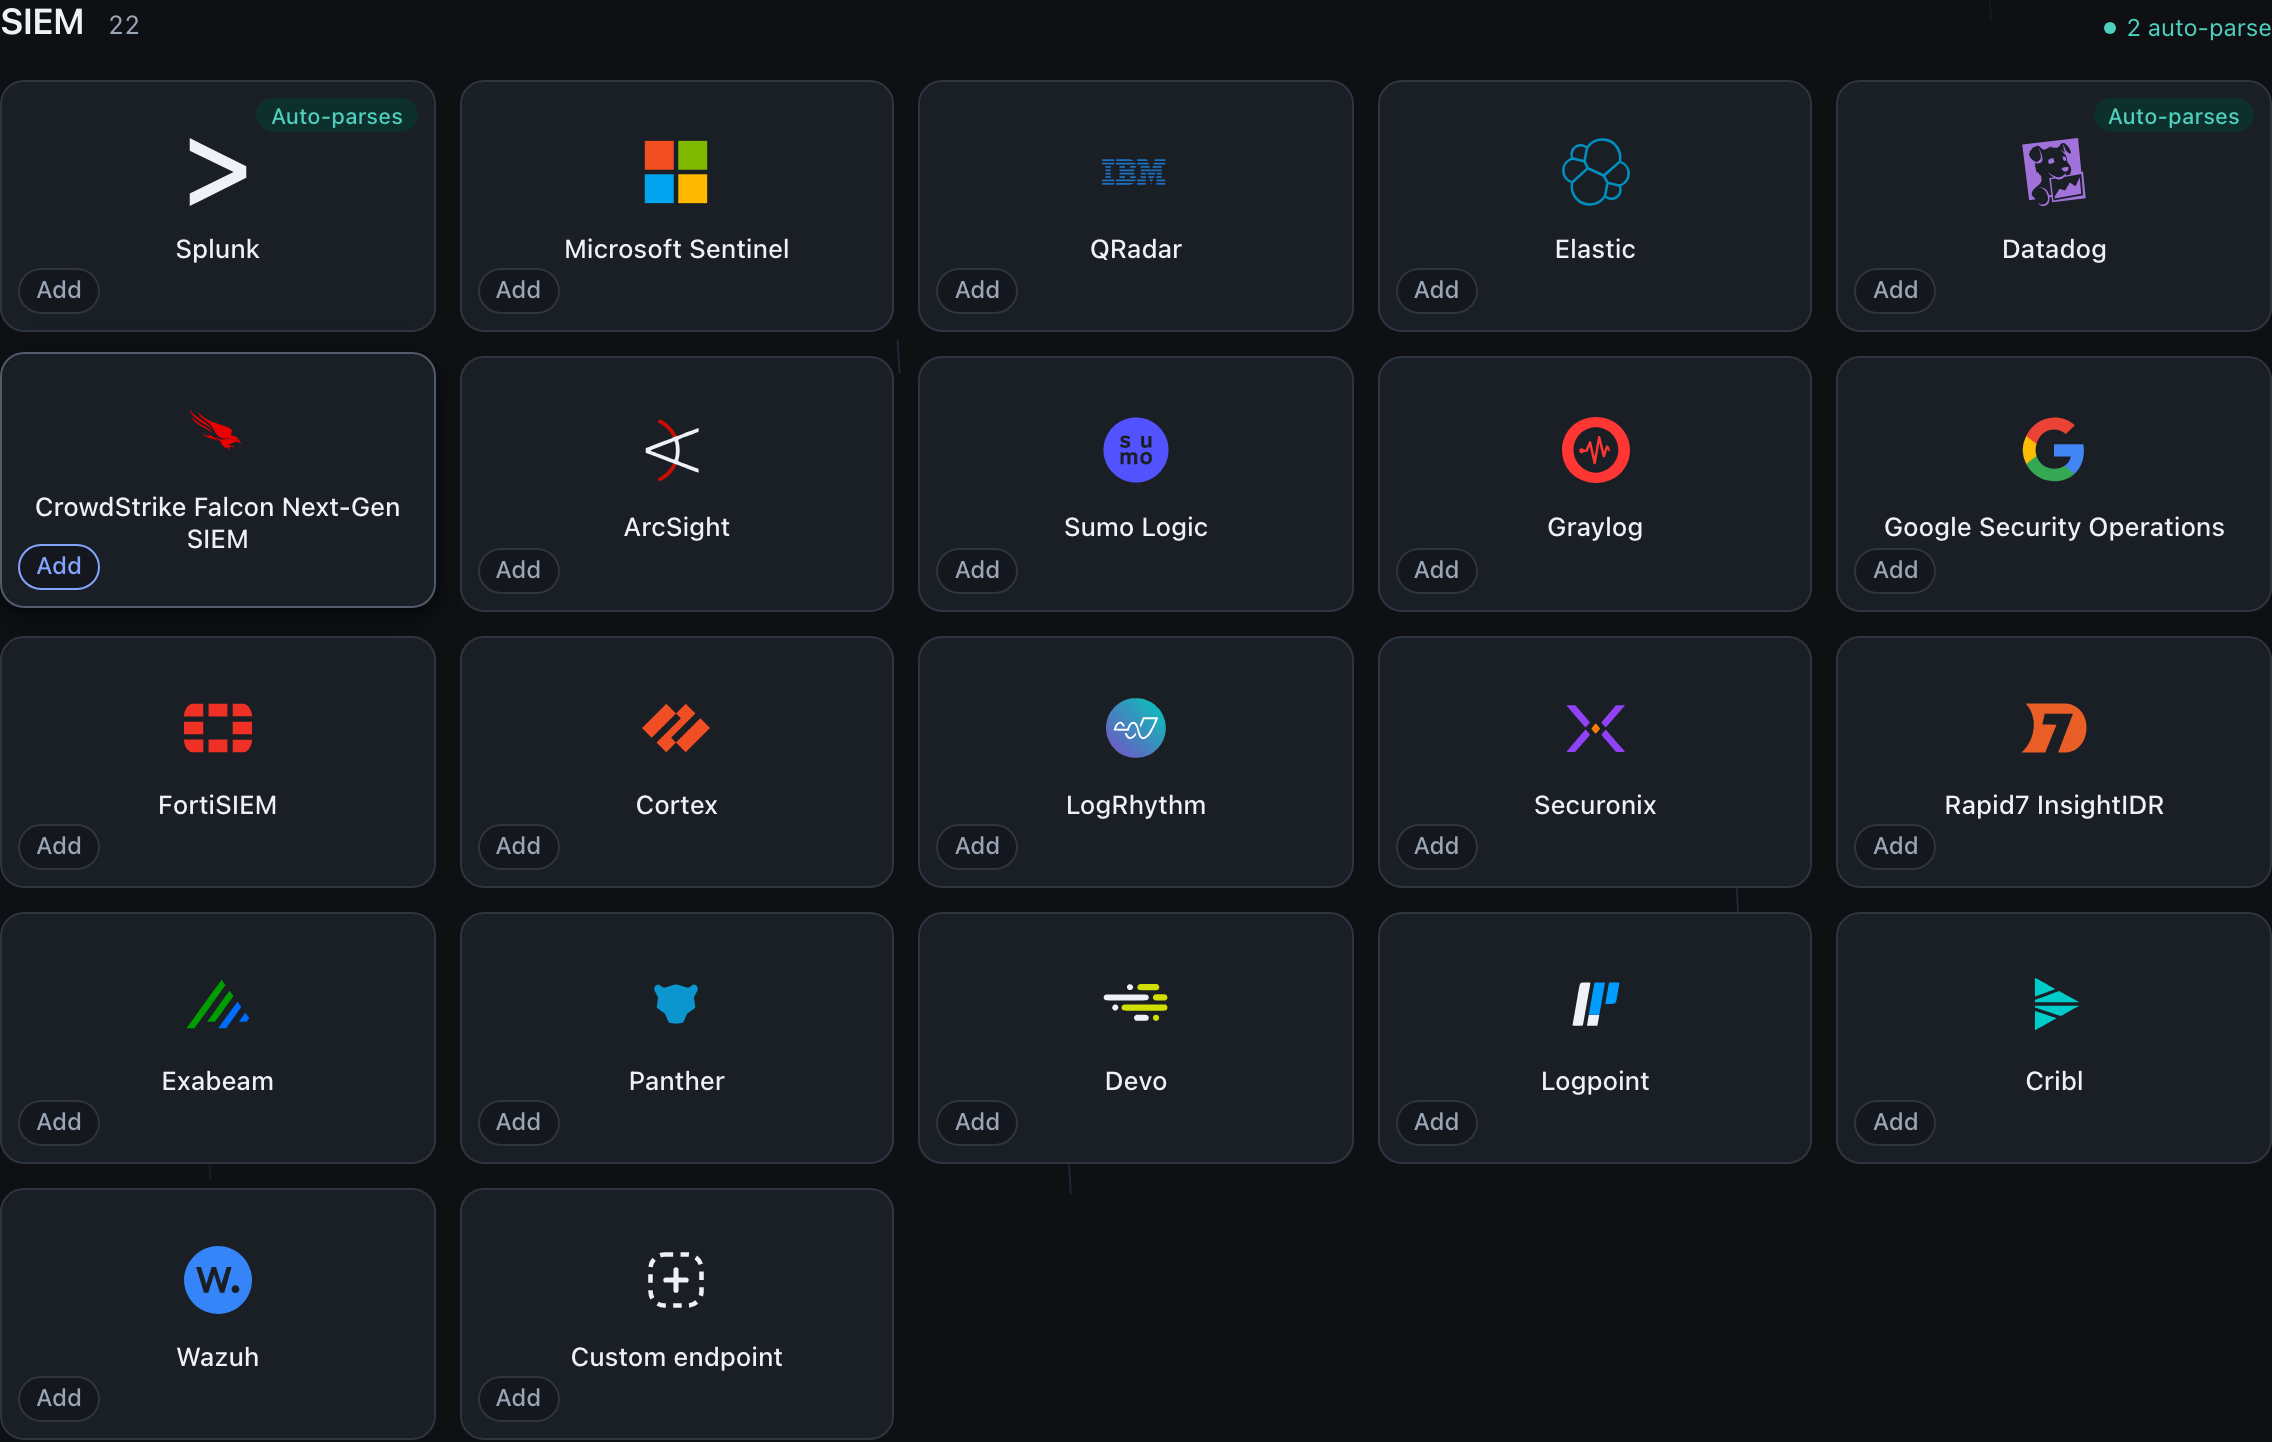
On the Integrations screen, the SIEM section counts twenty-two SIEM destinations, twenty-one named platforms plus a custom endpoint, and marks two of them as auto-parsing. The badge is on Splunk and Datadog, and on nothing else. The screen stacks all four of its categories on the one page, SIEM first, then Metrics and observability, Incident and on-call, and Chat and generic, so the SIEM section is the top of a longer scroll rather than a tab you switch to. Identity providers are not on that screen at all: they have their own rail item, Identity providers, and the rail shows it only to a caller who can run the key ceremony.
Monitoring
Alert your on-call and watch your fleet from your own tools. PagerDuty, Opsgenie and Jira Service Management get dedup and auto-resolve, and ServiceNow clears its alert on recovery. The incident.io, Grafana OnCall and Splunk On-Call tiles use the generic webhook, which sends no close itself. From engine 0.3.6, its body carries a stable dedupKey and marks a recovery with recovered: true, so your mapping can close a backup-failure, stale-backup or replication alert when it recovers, but not a canary alert. Metrics platforms read a Prometheus-compatible endpoint or take a direct OTLP push, and chat and email channels are notification-only. Each guide is the specific setup for that channel.
Every destination is opt-in, configured from your own console, and off until you set it up. Where a method is not confirmed on a platform, its guide says so.
Last updated .