
Reading the Runs activity view and per-run detail
Runs is the activity view: what ran, when, and with what result, across the whole fleet and per downpipe. A failed or abandoned run shows here, and a failed run shows its coarse reason inline. A run still in progress is a real state rather than a missing row. This page is the entry point to day-2 operations for the self-hoster. The page explains how to read the table, the per-run detail, and the verify-at-seal verdict that tells you whether a backup is internally sound.
The screen does not poll. The run history is a deliberate read you open, not a live dashboard, so it loads on arrival and refreshes in place when you ask it to, which keeps a filtered view from being wiped underneath you. Everything it shows is counts, sizes, and outcomes; nothing on this screen transmits, logs, or stores a secret or a key.
The history table
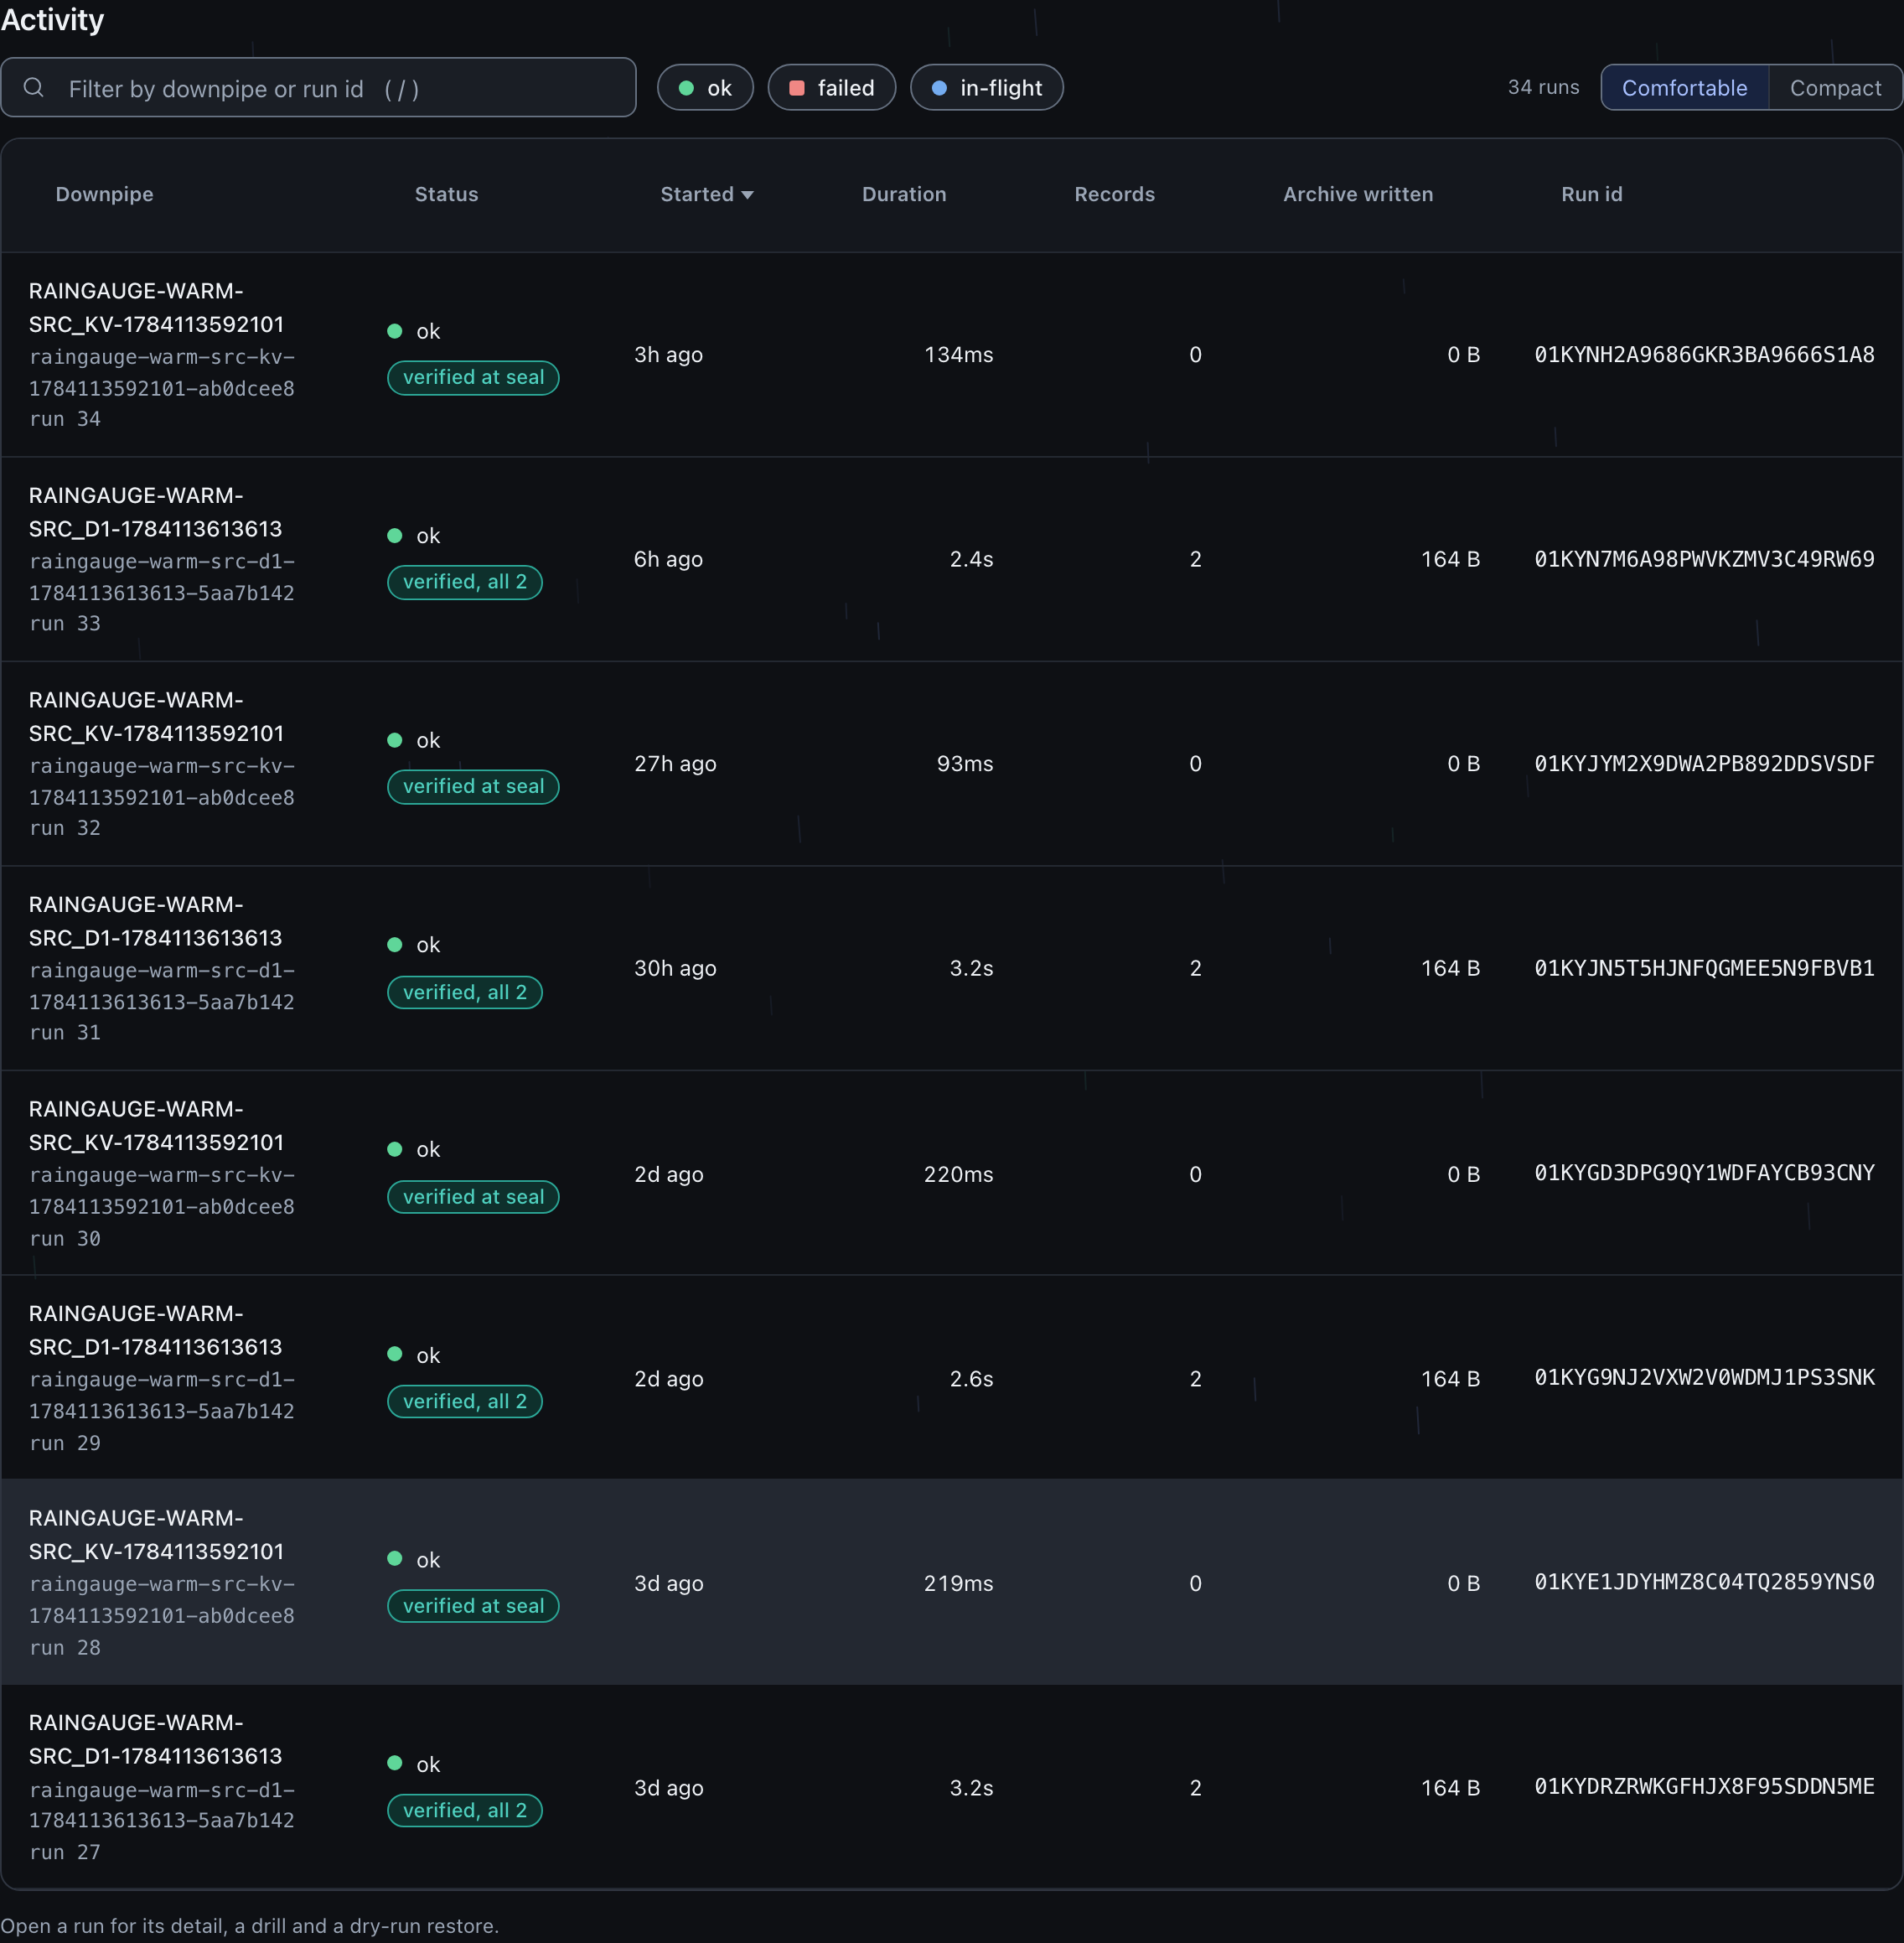
The table flattens every downpipe’s run ring into one fleet-wide, newest-first list. You can filter it by downpipe name or run id, narrow it with status facets, and re-sort any column; the filter and sort state is reflected into the URL so a filtered view survives a refresh and can be shared (buildTable and reflectStateInUrl, console/src/screens/runs/table.ts).
| Column | What it shows |
|---|---|
| Downpipe | The human name, with the slug id and run index demoted to a mono hint. |
| Status | The run’s resolved state, rendered as a hue, a shape, and a label rather than a raw string. A failed run shows its coarse reason beside the status. |
| Started | When the run began, relative with the absolute time on hover. |
| Duration | The run’s wall-clock duration, or a dash when not reported. |
| Records | The record count, or a dash when not reported. |
| Archive written | The new archive bytes written this run, never the plaintext read size. A dash when not reported. |
| Run id | The stable run id used to prefill a drill or a restore. |
A summary band above the table reads throughput, freshness, and outcome at a glance: the total runs and how many are ok, the failed-or-abandoned and in-flight counts, the age of the latest run, and the records and archive bytes written across the whole fleet. The band covers each downpipe’s recent-run history, capped at 50 runs per downpipe, and says so beneath the tiles. The band is always computed from the full run set, not the filtered or faceted view, so it stays a true read of fleet posture even while you are narrowed onto a single downpipe or status. A count that was not reported reads as a dash, never as a stale zero. A sum states how many runs actually contributed, so a partial wire shape does not read as a complete figure.

Run status, and the coarse error vocabulary
A run row carries one of four resolved states. The console renders each with a distinct hue and a word, so the state is legible without relying on colour alone. A failed run also carries a square dot and an abandoned run a triangle (runStatusTone, console/src/components/status.ts; the dot shapes in console/public/tokens.css).
| Status | Meaning |
|---|---|
ok | The run completed and sealed. Read the badges beside it before treating that as a full copy; the next section says why. |
failed | The run errored. The row carries a short, coarse reason. |
in-flight | The run is still going. This is a real state, not a missing or stale row. |
abandoned | The engine gave up on a run that never completed, and retired the in-flight row rather than leaving it in flight forever. It is neither a success nor still running, so it carries its own warn tone. |
Where an abandoned run shows up
The status facets cover ok, failed, abandoned and in-flight, and the ?status= deep link accepts each of them (STATUS_FACETS, console/src/screens/runs/types.ts). The guard on the query is derived from that list rather than repeating it, so a facet and its deep link cannot fall out of step.
The summary band counts a failed and an abandoned run together under Failed or abandoned, and that tile deep-links to /runs?status=failed,abandoned (buildSummary, console/src/screens/runs/summary.ts). The count reads amber rather than red when every run behind it was abandoned, because an abandoned run carries no diagnosed cause: the engine lost the run’s verdict rather than recording a failure against it.
The word in the Status cell is not the whole verdict. On an ok run, the badges beside the word carry the recoverability signal. Two can appear. A verify-at-seal verdict rides there as a quiet trust badge, or as a danger “seal suspect” badge when the read-back did not confirm. And a run short of its live source, by any of the incomplete, skipped or vanished record counts, carries a warn badge stating the total, because such a run still has a status of ok (shortfallLabel and the status cell in console/src/screens/runs/table.ts).
An `ok` run can be short of a full copy
ok means the run completed and sealed. It does not mean every record was captured. A run that skipped records, or found records that vanished mid-run, seals cleanly and reports ok, and the shortfall is stated on the warn badge, on a “Not fully captured” row in the detail drawer, and on the summary band’s latest-run tile as “ok, incomplete”.
Treat the badge as part of the status rather than decoration. A restore from a run that reads ok and carries that badge gives you back the records the run actually captured. The ones it did not are simply missing, which is the failure the badge exists to prevent.
When a run fails, its error is a short, enumerated reason, never a stack trace or an internal detail that could carry a secret. It is the run’s recorded result, so the console surfaces it as an expected inline outcome rather than an error toast. You will see the same coarse vocabulary in a support bundle and behind the matching notification.
Here is the whole vocabulary. The engine function that produces it is coarseRunError (engine/src/seal/slice.ts).
There are 21 of them, and they are closed: nothing but a member of this list can reach the row. Of those, 16 carry a remedy the engine itself states. The remaining 5 name the system at fault and state no action, and their rows say so.
| Reason on the failed run | What it means, and what to do |
|---|---|
destination access error | The engine names the system at fault and states no action. Treat the class as an attribution rather than an instruction: collect a support pack, which carries the correlation digest that joins this row to the engine log line. |
destination rejected the write (<code>) | Read the S3 code in the brackets: it is the store's own reason, passed through rather than collapsed into a class. It is the actionable half of a destination failure, and unlike a throttle it will not clear on its own. |
runlog write contended | Retry. This is compare-and-set contention on the run log, and it clears. A destination fault that will not clear is deliberately kept out of this class, so a run that keeps landing here is contending rather than misconfigured. |
shard enumeration incomplete (refused to sign a truncated archive) | Nothing was signed, which is the point: the engine found fewer shards than the checkpoint declared and refused to seal a short archive as a complete one. The found and expected counts are not on the run row; collect a support pack, which carries them. |
checkpoint unwrap failed (resume state unreadable; signer may have rotated) | The in-flight run cannot resume and will not recover by retrying that run. If the signing key was rotated while the run was in flight, that is the cause: the checkpoint was wrapped under the previous signer. Start a fresh run. |
seal DO handoff refused (<class>)<class> is one of invalid-payload, worker-spawn-refused, do-error, unreachable. | The fault is inside the engine's own control plane, not at your destination. The sub-class in the brackets says which handoff refused and is re-gated against a closed list, so it is never a passed-through message. Retry the run; if the same sub-class repeats, raise it with the cause digest. |
seal DO handoff refused | As above, with no sub-class recovered. Read it as the engine's control plane, not your destination: the class keeps an engine-side refusal from being read as a fault in your bucket. |
internal invariant violated | Change nothing about your configuration. The engine states this is its own bug rather than a misconfiguration, so no source, destination or schedule change will clear it. Collect a support pack and raise it. |
shard id overflow (refused to seal a misordered archive) | The engine names the system at fault and states no action. Treat the class as an attribution rather than an instruction: collect a support pack, which carries the correlation digest that joins this row to the engine log line. |
resume state divergent (mid-record resume refused) | The engine names the system at fault and states no action. Treat the class as an attribution rather than an instruction: collect a support pack, which carries the correlation digest that joins this row to the engine log line. |
source cannot range-read (chunked capture unavailable) | The record is too large to take in one piece and its source offers no ranged read, so it can never be chained across windows. The size ceiling is not the thing to change: capture that record out of band. The engine names this class ahead of the ceiling class for exactly that reason. |
record over the in-band size ceiling (recover it out of band) | Recover that record out of band, as the class says. This is a documented ceiling with a documented remedy rather than a source fault, and the rest of the run is unaffected. |
unsupported source type | This is a configuration fault, not a source fault: the downpipe names a source type this engine build cannot back up. Do not go looking at the source, which is healthy. Remove or replace the source, or move to an engine build that supports it. |
source resource missing | The binding is present but the thing it points at (the KV namespace, R2 bucket or D1 database) is gone. Re-create the resource or repoint the source. This class exists so you are told the resource is missing rather than handed a destination error for a source-side fault. |
source binding error | The binding the downpipe names is not present in this deployment. The usual cause is a deploy that replaced the worker's bindings; deploy with the command that reads the live bindings and ships a superset, and check the Sources screen for a binding flagged missing. |
source too large to back up in one slice (not yet resumable) | There is no in-product remedy today, and the class says so: this source cannot be split across slices yet. Narrow the source so one slice can finish it. |
source read error | The engine names the system at fault and states no action. Treat the class as an attribution rather than an instruction: collect a support pack, which carries the correlation digest that joins this row to the engine log line. |
cf-config source needs an accountId (re-save the source with an account id) | Re-save the source with an account id, as the class says. Validation refuses a cf-config source without an account id, so re-saving the source with one is the whole fix. |
source listing exceeded the page cap (too many items to enumerate in one run; narrow the source selector) | Narrow the source selector, as the class says. The surface holds more items than one run can enumerate. This is a discovery failure with a structural cause, not a transient one, so retrying unchanged will land here again. |
engine not fully configured | Required configuration is absent on the engine. Complete the deployment configuration and re-run; no retry clears it while a required value is unset. |
run failed | The engine names the system at fault and states no action. Treat the class as an attribution rather than an instruction: collect a support pack, which carries the correlation digest that joins this row to the engine log line. |
Two things about the table are worth knowing before you read a row.
The order is the classification order, and it decides ties. The engine takes the first branch that matches, so a fault whose message carries two recognisable shapes is reported as the higher one. That is why a source read failure mentioning an HTTP status is a source read error rather than a destination one, and why a refused handoff inside the engine is not reported as your destination being unreachable.
The reason on the row is all you get, by design. The raw message can name a record or an object key, which the archive encrypts end to end, so it never rides on the row or in a log line. What travels instead is a short one-way digest of the raw message, stamped on the failed row and on the matching engine log line, so support can join the two without either carrying the text. Quote that digest when you raise a failed run. From console 0.2.7, the failed run’s detail drawer shows it as Support reference, below the failure verdict. A run from an engine that does not record the digest shows no reference.
The per-run detail
Opening a run shows its full detail in a drawer. The header carries the downpipe name, the slug id, and the status badge; the body breaks the run down into its run facts, its throughput, and, when present, its verify-at-seal verdict.
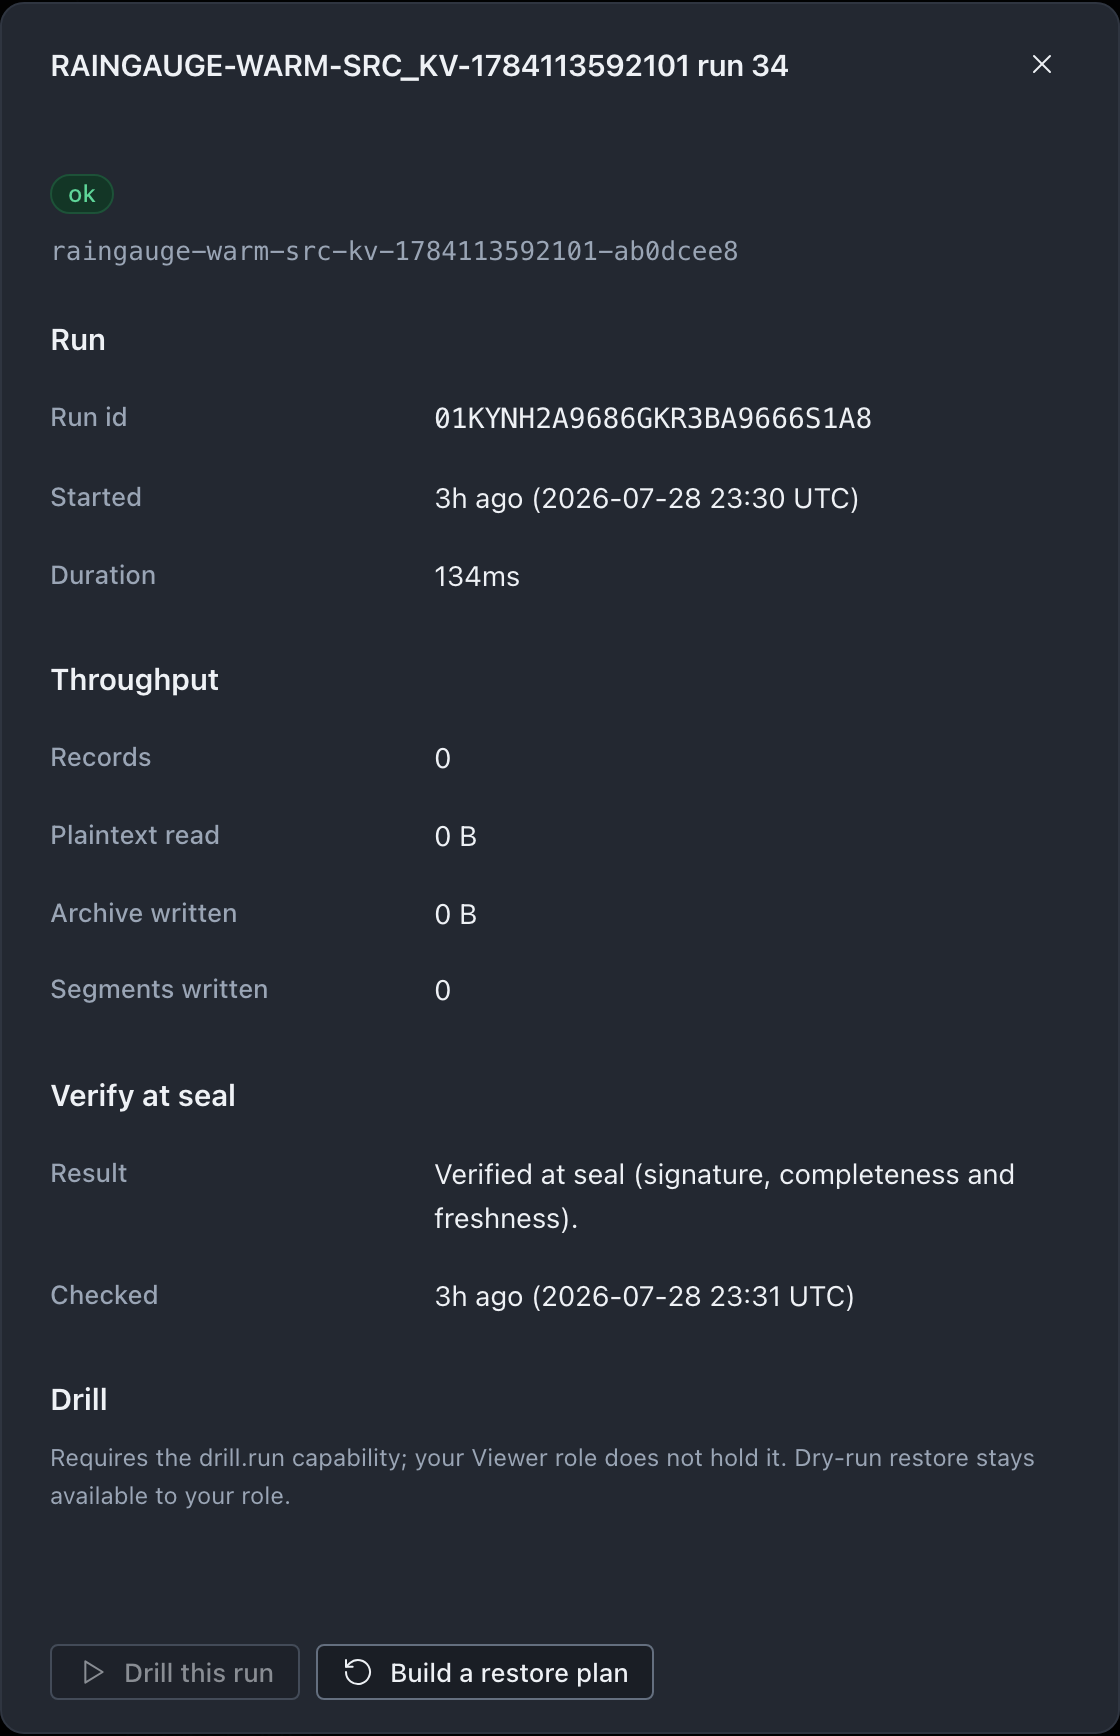
The Run section also names the run’s predecessor: the id of the downpipe’s previous successful run, so you can walk the chain backwards from the console rather than only from the sealed archive itself. A run with no recorded predecessor, such as a downpipe’s first run, reads “None (the engine recorded no predecessor for this run)”. A predecessor that has aged out of the retained run-history window still shows its id. A note states that this is a bounded window rather than a broken chain.
The throughput section is where two different byte figures sit side by side, and the difference matters.
| Figure | What it measures |
|---|---|
| Records | How many records the run backed up. |
| Plaintext read | The total plaintext size the run read from the source before encryption. |
| Archive written | The new bytes actually written to the destination archive this run. |
| Segments written | The object count written, meaning segments plus the manifest, not skipped objects. |
Plaintext read and archive written are not the same quantity and the larger one is usually the plaintext read. The archive is compressed and encrypted, and an incremental run writes only what changed, so archive written can be much smaller than the plaintext the run scanned. The table’s “Archive written” column shows the written figure only and never borrows the plaintext read in its place, so the column and the summary band agree. The segment count is the unit the archive is split into for streaming, so a large run writes many segments and a small one writes few.
The verify-at-seal verdict
Right after a run seals the archive and the run log to the destination, and before the run is reported a clean success, the engine reads the just-written archive back from the destination and verifies it. This catches a corrupt or partial backup at seal time rather than at the next periodic drill, which could be up to a week later. The result is recorded on the run row as a verdict and rendered calmly in the drawer (verifyAtSeal, engine/src/seal/verify-at-seal.ts; the drawer in console/src/screens/runs/detail.ts).
The verdict is one of two states.
| Verdict | What it means |
|---|---|
| Verified | The bytes that landed are internally consistent and correctly signed. The verdict also names the depth that ran, so you can tell a keyless chain attestation from a run that also decrypt-checked a sample of records or every record. |
| Suspect | The read-back verification did not pass. The run still completed, the archive was not deleted, and the verdict carries a short, coarse, secret-free reason. |
A verified verdict at the keyless tier confirms three things about the archive: the hybrid signature over the stored root holds, every signed shard is present and hashes to that root, and the anti-rollback freshness check passes. When the run is not too large, it goes further and decrypt-checks records as well, and the verdict says how many. By default, a run of up to 64 MiB of plaintext has every record checked. A larger run has an evenly spaced sample checked.
That deeper check does not depend on your posture: the engine reaches the run’s key either by decapsulating its recipient wrap with the operational key, or from the per-run key it still holds while finalising that run, so a break-glass-only downpipe gets it too. The verdict records which route was used, because they prove different things: opening the wrap also proves that wrap opens, while opening from the run’s own key proves the bytes decrypt and says nothing about any wrap. When neither route is available, the sample size SEAL_VERIFY_SAMPLE is set to 0, or the run is too large or has too many shards, verification is the keyless tier only and the verdict names the reason rather than claiming a deeper check it did not run.
A verify-at-seal verdict is an engine-side check of the archive’s completeness and anti-rollback, performed by reading the bytes back from your destination. It is not a check performed by Cloudflare, and it is tamper-evident rather than a guarantee that corruption is impossible. A suspect verdict is a real recoverability signal: the run was not failed and nothing was deleted, but you should investigate the archive before relying on that run, and the quickest confirmation is to run a drill.
Drill and dry-run restore from a run
A run’s drawer is also where you exercise recovery against that specific backup, and the two actions are gated differently on purpose.
The Drill action drills the specific run whose drawer is open, not necessarily the latest one: you can open any run in the history table and drill that one. With the operational key present it verifies the chain end to end and restores a sample record while writing nothing back; the result carries isLatest, so a drill on an older run tells you that it is not the latest run.
It is the in-account proof that the backup is recoverable. The Drill action is gated on the drill.run capability, which Operator, Approver, Restore-operator and Owner hold and Viewer and Access-admin do not. A role without it sees a disabled Drill button with the reason, plus a note that dry-run restore stays available if it holds restore.dryrun. A passing drill records a dated recoverability entry best-effort, so a trail exists. On a break-glass-only posture, the drill returns an expected outcome that says recovery must be rehearsed offline. The console presents that outcome as the normal result of that posture, rather than a fault.
The dry-run restore builds a restore plan from the run and is available from the Viewer role up, one rung lower than the drill, so a read-only operator can still see what a recovery would write without being able to launch a drill. Building a plan does not write anything; it is the safe first step of the restore flow.
Neither the drill nor the dry-run restore is a point-in-time, choose-any-timestamp restore screen. The console works from a specific run you select rather than an arbitrary clock time. The restore screen’s browse-by-date modal does call the engine’s point-in-time resolver, but only to read the authoritative floor of the recent-run history ring; picking a day still lands you on a real run. The recovery point you act on is a real run, and the freshest one is the newest good run shown in the summary band.
Tying runs back to alerts
What you read here is the same outcome that drives the notification stream. A failed run is what backup-failure alerts on, a downpipe whose runs stop happening is what backup-stale alerts on, and a scheduled restore test maps to restore-test-pass or restore-test-fail. A suspect verify-at-seal verdict is itself routed as a restore-test-fail at critical, so a backup that looks fine in the table but failed its read-back will page you. Reading a run’s detail is how you confirm what an alert is telling you.
Where this fits
For the catalogue of the events that fire and their severities, read what downpipes alerts you about. To route those events to a channel, read the notifications guide. To see how a backup flows from source to destination across the fleet, read the topology view. The verify-at-seal mechanism in the context of a backup run is covered in verify at seal. The drill, as a recoverability proof, is covered in prove recoverability. For what a restore can and cannot write back, see what restore can and cannot write back.
Last updated .